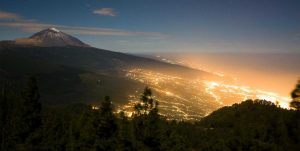
Artificial night lighting – light pollution

The footprint of human occupation is uniquely visible from space in the form of artificial night lighting – ranging from the burning of the rainforest to massive offshore fisheries to the omnipresent lights of cities and
towns and related connecting road networks (Aubrecht et al. 2008b, Doll 2008). The National Oceanic and Atmospheric Administration, National Geophysical Data Center (NOAA-NGDC) processes and archives nighttime lights data acquired by the U.S. Air Force Defense Meteorological Satellite Program (DMSP) Operational Linescan System (OLS) which was initially designed to monitor the global distribution of clouds using visible and thermal infrared spectral bands. The DMSP satellites are in a sun-synchronous, low altitude polar orbit. With 14 orbits collected per day and a 3,000 km swath width, each OLS is capable of collecting a
complete set of images of the earth every 24 hours. At night the visible band signal is intensified with a photomultiplier tube (PMT) to enable the detection of moonlit clouds. The boost in gain enables the unique
capability of observing lights present at the earth’s surface at night. Most of the lights are from human settlements (Elvidge et al. 1997) and ephemeral fires (Elvidge et al. 2001a). Furthermore gas flares and
offshore platforms as well as heavily lit fishing boats can be identified.
NOAA-NGDC archives the long-term DMSP data from 1992 to present. For this project individual orbits were processed with automatic algorithms (described in Elvidge et al. 1997, 2001b) identifying image features (such as lights and clouds) and quality of the nighttime data. A cloud-free composite of nighttime lights was produced for 2003 using data from DMSP satellite F-15 (see figure 2). To identify the best nighttime lights data for creating an annual composite we adhered to the following standards:
• Only the center half of the orbital swath was used (best geolocation and sharpest features)
• Sunlight and moonlight were not present
• No solar glare contamination was allowed
• Only cloud-free images were used (based on thermal detection of clouds)
Nighttime image data from individual orbits meeting these criteria are the basis for a global latitude-longitude grid with 30 arc second resolution cells. This grid cell size corresponds to approximately 1
kilometer at the equator. In order to estimate the frequency with which lighting was present the total number of coverages and number of cloud-free coverages are tallied. The nighttime lights product used in the
presented analysis is the average digital number in the visible band of cloud-free light detections multiplied by the percent frequency of light detection. The inclusion of the percent frequency of detection term
normalizes the resulting digital values for variations in the persistence of flaring. For instance the value for a gas flare only detected half the time is discounted by 50 %. Background noise and land based fires were
filtered out.

